Innotop是一个优秀的命令行程序,类似' top命令 “来监视InnoDB引擎下运行的本地和远程的MySQL服务器。 Innotop具有许多功能和不同类型的模式/选项,这有助于监视MySQL性能的不同方面,还有助于数据库管理员了解MySQL服务器出了什么问题。
例如,Innotop有助于监控MySQL的复制状态 , 用户统计 , 查询列表 ,InnoDB的缓冲区 ,InnoDB的I / O信息 , 打开表 , 锁表等 ,并定期刷新它的数据,所以你可以看到更新的结果。

Innotop MySQL服务器监控
Innotop自带的强大功能和灵活性,并不需要任何额外的配置,它可以通过只从终端运行“innotop”命令来执行。
安装Innotop(MySQL监控)
默认情况下是不包含在Linux发行版,如RHEL,CentOS的 ,Fedora和Linux的科学包innotop。 你需要通过启用第三方来安装它EPEL软件库 ,并使用yum命令,如下图所示。
# yum install innotop
示例输出
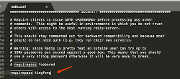
Loaded plugins: fastestmirror
Loading mirror speeds from cached hostfile
* base: centos.mirror.net.in
* epel: epel.mirror.net.in
* epel-source: epel.mirror.net.in
* extras: centos.mirror.net.in
* updates: centos.mirror.net.in
Setting up Install Process
Resolving Dependencies
--> Running transaction check
---> Package innotop.noarch 0:1.9.0-3.el6 will be installed
--> Finished Dependency Resolution
Dependencies Resolved
==========================================================================================================
Package			Arch		Version			Repository		Size
==========================================================================================================
Installing:
innotop                        noarch          1.9.0-3.el6             epel                    149 k
Transaction Summary
==========================================================================================================
Install       1 Package(s)
Total download size: 149 k
Installed size: 489 k
Is this ok [y/N]: y
Downloading Packages:
innotop-1.9.0-3.el6.noarch.rpm                                                      | 149 kB    00:00
Running rpm_check_debug
Running Transaction Test
Transaction Test Succeeded
Running Transaction
Installing : innotop-1.9.0-3.el6.noarch							1/1
Verifying  : innotop-1.9.0-3.el6.noarch                                                       1/1
Installed:
innotop.noarch 0:1.9.0-3.el6
Complete!
要启动innotop,只需键入“innotop”分别指定选项-u( 用户名 )和-p( 密码 ),在命令行,然后按Enter。
# innotop -u root -p 'tecm1nt'
一旦你连接到MySQL服务器时 ,你应该会看到类似下面的屏幕东西。
[RO] Dashboard (? for help)                                                                    localhost, 61d, 254.70 QPS, 5/2/200 con/run/cac thds, 5.1.61-log
Uptime  MaxSQL  ReplLag  Cxns  Lock  QPS     QPS  Run  Run  Tbls  Repl   SQL
61d                      4     0  254.70  _         _     462  Off 1
Innotop帮助
按“?”得到的命令行选项和使用情况的总结。
Switch to a different mode:
A  Dashboard         I  InnoDB I/O Info     Q  Query List
B  InnoDB Buffers    K  InnoDB Lock Waits   R  InnoDB Row Ops
C  Command Summary   L  Locks               S  Variables & Status
D  InnoDB Deadlocks  M  Replication Status  T  InnoDB Txns
F  InnoDB FK Err     O  Open Tables         U  User Statistics
Actions:
d  Change refresh interval        p  Pause innotop
k  Kill a query's connection      q  Quit innotop
n  Switch to the next connection  x  Kill a query
Other:
TAB  Switch to the next server group   /  Quickly filter what you see
!  Show license and warranty         =  Toggle aggregation
#  Select/create server groups       @  Select/create server connections
$  Edit configuration settings       \  Clear quick-filters
Press any key to continue
本节包含innotop使用的屏幕截图。 使用大写键在模式之间切换。
用户统计
该模式显示用户统计和排序的读取索引统计信息 。
CXN        When   Load  QPS    Slow  QCacheHit  KCacheHit  BpsIn    BpsOut
localhost  Total  0.00  1.07k   697      0.00%     98.17%  476.83k  242.83k
查询列表
这一模式可以显示SHOW FULL PROCESSLIST输出,类似于mytop的查询列表模式。 此功能不显示InnoDB的信息,它是普遍使用最有用的。
When   Load  Cxns  QPS   Slow  Se/In/Up/De%             QCacheHit  KCacheHit  BpsIn    BpsOut
Now    0.05     1  0.20     0   0/200/450/100               0.00%    100.00%  882.54   803.24
Total  0.00   151  0.00     0  31/231470/813290/188205      0.00%     99.97%    1.40k    0.22
Cmd      ID      State               User      Host           DB      Time      Query
Connect      25  Has read all relay  system u                         05:26:04
InnoDB I / O信息
该模式显示InnoDB的I / O统计数据 , 等待I / O,I / O线程 , 文件I / O和默认日志统计表格。
____________________ I/O Threads ____________________
Thread  Purpose               Thread Status
0  insert buffer thread  waiting for i/o request
1  log thread            waiting for i/o request
2  read thread           waiting for i/o request
3  write thread          waiting for i/o request
____________________________ Pending I/O _____________________________
Async Rds  Async Wrt  IBuf Async Rds  Sync I/Os  Log Flushes  Log I/Os
0          0               0          0            0         0
________________________ File I/O Misc _________________________
OS Reads  OS Writes  OS fsyncs  Reads/Sec  Writes/Sec  Bytes/Sec
26          3          3       0.00        0.00          0
_____________________ Log Statistics _____________________
Sequence No.  Flushed To  Last Checkpoint  IO Done  IO/Sec
0 5543709     0 5543709   0 5543709              8    0.00
InnoDB缓冲区
本节中,您将看到有关InnoDB缓冲池 , 页面统计 , 插入缓冲和适应性的散列索引信息。 从SHOW INNODB STATUS的数据获取。
__________________________ Buffer Pool __________________________
Size  Free Bufs  Pages  Dirty Pages  Hit Rate  Memory  Add'l Pool
512        492     20            0  --        16.51M     841.38k
____________________ Page Statistics _____________________
Reads  Writes  Created  Reads/Sec  Writes/Sec  Creates/Sec
20       0        0       0.00        0.00         0.00
______________________ Insert Buffers ______________________
Inserts  Merged Recs  Merges  Size  Free List Len  Seg. Size
0            0       0     1              0          2
__________________ Adaptive Hash Index ___________________
Size    Cells Used  Node Heap Bufs  Hash/Sec  Non-Hash/Sec
33.87k                           0      0.00          0.00
InnoDB行操作
在这里,你会看到InnoDB的行操作 , 行操作杂项 , 信号的输出,并默认等待阵列表。
________________ InnoDB Row Operations _________________
Ins  Upd  Read  Del  Ins/Sec  Upd/Sec  Read/Sec  Del/Sec
0    0     0    0     0.00     0.00      0.00     0.00
________________________ Row Operation Misc _________________________
Queries Queued  Queries Inside  Rd Views  Main Thread State
0               0         1  waiting for server activity
_____________________________ InnoDB Semaphores _____________________________
Waits  Spins  Rounds  RW Waits  RW Spins  Sh Waits  Sh Spins  Signals  ResCnt
2      0      41         1         1         2         4        5       5
____________________________ InnoDB Wait Array _____________________________
Thread  Time  File  Line  Type  Readers  Lck Var  Waiters  Waiting?  Ending?
命令摘要
该命令摘要模式显示所有cmd_summary表,它类似于以下。
_____________________ Command Summary _____________________
Name                    Value     Pct     Last Incr  Pct
Com_update              11980303  65.95%          2  33.33%
Com_insert               3409849  18.77%          1  16.67%
Com_delete               2772489  15.26%          0   0.00%
Com_select                   507   0.00%          0   0.00%
Com_admin_commands           411   0.00%          1  16.67%
Com_show_table_status        392   0.00%          0   0.00%
Com_show_status              339   0.00%          2  33.33%
Com_show_engine_status       164   0.00%          0   0.00%
Com_set_option               162   0.00%          0   0.00%
Com_show_tables               92   0.00%          0   0.00%
Com_show_variables            84   0.00%          0   0.00%
Com_show_slave_status         72   0.00%          0   0.00%
Com_show_master_status        47   0.00%          0   0.00%
Com_show_processlist          43   0.00%          0   0.00%
Com_change_db                 27   0.00%          0   0.00%
Com_show_databases            26   0.00%          0   0.00%
Com_show_charsets             24   0.00%          0   0.00%
Com_show_collations           24   0.00%          0   0.00%
Com_alter_table               12   0.00%          0   0.00%
Com_show_fields               12   0.00%          0   0.00%
Com_show_grants               10   0.00%          0   0.00%
变量和状态
这部分计算统计数据,比如每秒查询 ,并显示出他们在不同模式下的数字。
QPS     Commit_PS     Rlbck_Cmt  Write_Commit     R_W_Ratio      Opens_PS   Tbl_Cch_Usd    Threads_PS  Thrd_Cch_Usd CXN_Used_Ever  CXN_Used_Now
0             0             0      18163174             0             0             0             0             0          1.99          1.32
0             0             0      18163180             0             0             0             0             0          1.99          1.32
0             0             0      18163188             0             0             0             0             0          1.99          1.32
0             0             0      18163192             0             0             0             0             0          1.99          1.32
0             0             0      18163217             0             0             0             0             0          1.99          1.32
0             0             0      18163265             0             0             0             0             0          1.99          1.32
0             0             0      18163300             0             0             0             0             0          1.99          1.32
0             0             0      18163309             0             0             0             0             0          1.99          1.32
0             0             0      18163321             0             0             0             0             0          1.99          1.32
0             0             0      18163331             0             0             0             0             0          1.99          1.32
复制状态
在这种模式下,你会看到从SQL状态 , 从I / O状态和主状态的输出。 前两个部分显示从属地位和从I / O线程状态 ,最后一节显示了大师的地位 。
_______________________ Slave SQL Status _______________________
Master        On?  TimeLag  Catchup  Temp  Relay Pos  Last Error
172.16.25.125  Yes    00:00     0.00     0   41295853
____________________________________ Slave I/O Status _____________________________________
Master        On?  File              Relay Size  Pos       State
172.16.25.125  Yes  mysql-bin.000025      39.38M  41295708  Waiting for master to send event
____________ Master Status _____________
File              Position  Binlog Cache
mysql-bin.000010  10887846         0.00%
非交互式
您可以在非交互式运行“innotop”。
# innotop --count 5 -d 1 -n
uptime	max_query_time	time_behind_master	connections	locked_count	qps	spark_qps	run	spark_run	open	slave_running	longest_sql
61d			2	0	0.000363908088893752				64	Yes
61d			2	0	4.96871146980749	_		_	64	Yes
61d			2	0	3.9633543857494	^_		__	64	Yes
61d			2	0	3.96701862656428	^__		___	64	Yes
61d			2	0	3.96574802684297	^___		____	64	Yes
监视远程数据库
监视远程系统上的远程数据库,请使用特定的用户名 , 密码和主机名下面的命令。
# innotop -u username -p password -h hostname
有关“innotop”的使用和选项的详细信息,通过碰撞终端上的“ 人innotop”查看手册页。
参考链接
另请参阅 :