Ngrep ( 网络grep )是一个简单但功能强大的网络数据包分析器。 它是一种应用于网络层的类似grep的工具 - 它匹配通过网络接口传递的流量。 它允许您指定扩展的常规或十六进制表达式,以匹配数据包的数据有效负载(传输数据中的实际信息或消息,但不包括自动生成的元数据)。
此工具适用于各种类型的协议,包括IPv4 / 6,TCP,UDP,ICMPv4 / 6,IGMP以及许多接口上的Raw。 它的运行方式与tcpdump数据包嗅探工具相同 。
可以使用包管理工具从主流Linux发行版中的默认系统存储库安装ngrep包,如图所示。
$ sudo apt install ngrep
$ sudo yum install ngrep
$ sudo dnf install ngrep
安装ngrep后 ,您可以使用以下示例开始分析Linux网络上的流量。
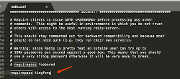
1.以下命令将帮助您匹配默认工作界面上的所有ping请求。 您需要打开另一个终端并尝试ping另一台远程计算机。 -q标志告诉ngrep安静地工作,不输出除包头及其有效载荷之外的任何信息。
$ sudo ngrep -q '.' 'icmp'
interface: enp0s3 (192.168.0.0/255.255.255.0)
filter: ( icmp ) and ((ip || ip6) || (vlan && (ip || ip6)))
match: .
I 192.168.0.104 -> 192.168.0.103 8:0
]...~oG[....j....................... !"#$%&'()*+,-./01234567
I 192.168.0.103 -> 192.168.0.104 0:0
]...~oG[....j....................... !"#$%&'()*+,-./01234567
I 192.168.0.104 -> 192.168.0.103 8:0
]....oG[............................ !"#$%&'()*+,-./01234567
I 192.168.0.103 -> 192.168.0.104 0:0
]....oG[............................ !"#$%&'()*+,-./01234567
您可以按Ctrl + C终止它。
2.要仅匹配转到特定目标站点的流量,例如“google.com” ,请运行以下命令,然后尝试从浏览器访问它。
$ sudo ngrep -q '.' 'host google.com'
interface: enp0s3 (192.168.0.0/255.255.255.0)
filter: ( host google.com ) and ((ip || ip6) || (vlan && (ip || ip6)))
match: .
T 172.217.160.174:443 -> 192.168.0.103:54008 [AP]
..................;.(...RZr..$....s=..l.Q+R.U..4..g.j..I,.l..:{y.a,....C{5>[email protected]
T 172.217.160.174:443 -> 192.168.0.103:54008 [AP]
.............l.......!,0hJ....0.%F..!...l|.........PL..X...t..T.2DC..... ..y...~Y;[email protected]
3.如果您在网上冲浪,请运行以下命令来监控浏览器请求的文件:
$ sudo ngrep -q '^GET .* HTTP/1.[01]'
interface: enp0s3 (192.168.0.0/255.255.255.0)
filter: ((ip || ip6) || (vlan && (ip || ip6)))
match: ^GET .* HTTP/1.[01]
T 192.168.0.104:43040 -> 172.217.160.174:80 [AP]
GET / HTTP/1.1..Host: google.com..User-Agent: Links (2.13; Linux 4.17.6-1.el7.elrepo.x86_64 x86_64;
GNU C 4.8.5; text)..Accept: */*..Accept-Language: en,*;q=0.1..Accept-
Encoding: gzip, deflate, bzip2..Accept-Charset: us-ascii,ISO-8859-1,ISO-8859-2,ISO-8859-3,ISO-8859-4,
ISO-8859-5,ISO-8859-6,ISO-8859-7,ISO-8859-8,ISO-8859-9,ISO-8859-10,I
SO-8859-13,ISO-8859-14,ISO-8859-15,ISO-8859-16,windows-1250,windows-1251,windows-1252,windows-1256,
windows-1257,cp437,cp737,cp850,cp852,cp866,x-cp866-u,x-mac,x-mac-ce,x-
kam-cs,koi8-r,koi8-u,koi8-ru,TCVN-5712,VISCII,utf-8..Connection: keep-alive....
4.要查看跨源或目标端口25 ( SMTP )的所有活动,请运行以下命令。
$ sudo ngrep port 25
5.要监视任何基于网络的syslog流量以查找单词“error”的出现 ,请使用以下命令。
$ sudo ngrep -d any 'error' port 514
重要的是,此工具可以将存储在“/ etc / services” (在类似Unix的系统(如Linux)上)的服务端口名称转换为端口号。 此命令等同于上面的命令。
$ sudo ngrep -d any 'error' port syslog
6.您还可以对HTTP服务器(端口80 )运行ngrep,它将匹配对目标主机的所有请求,如图所示。
$ sudo ngrep port 80
interface: eth0 (64.90.164.72/255.255.255.252)
filter: ip and ( port 80 )
####
T 67.169.59.38:42167 -> 64.90.164.74:80 [AP]
GET / HTTP/1.1..User-Agent: Mozilla/4.0 (compatible; MSIE 6.0; X11; Linux i
686) Opera 7.21  [en]..Host: www.darkridge.com..Accept: text/html, applicat
ion/xml;q=0.9, application/xhtml+xml;q=0.9, image/png, image/jpeg, image/gi
f, image/x-xbitmap, */*;q=0.1..Accept-Charset: iso-8859-1, utf-8, utf-16, *
;q=0.1..Accept-Encoding: deflate, gzip, x-gzip, identity, *;q=0..Cookie: SQ
MSESSID=5272f9ae21c07eca4dfd75f9a3cda22e..Cookie2: $Version=1..Connection:
Keep-Alive, TE..TE: deflate, gzip, chunked, identity, trailers....
##
正如您在上面的输出中所看到的,所有HTTP标头传输都以其血腥细节显示。 但是很难解析,所以让我们看看当你应用-W byline模式时会发生什么。
$ sudo ngrep -W byline port 80
interface: eth0 (64.90.164.72/255.255.255.252)
filter: ip and ( port 80 )
####
T 67.169.59.38:42177 -> 64.90.164.74:80 [AP]
GET / HTTP/1.1.
User-Agent: Mozilla/4.0 (compatible; MSIE 6.0; X11; Linux i686) Opera ...
Host: www.darkridge.com.
Accept: text/html, application/xml;q=0.9, application/xhtml+xml;q=0.9 ...
Accept-Charset: iso-8859-1, utf-8, utf-16, *;q=0.1.
Accept-Encoding: deflate, gzip, x-gzip, identity, *;q=0.
Cookie: SQMSESSID=5272f9ae21c07eca4dfd75f9a3cda22e.
Cookie2: $Version=1.
Cache-Control: no-cache.
Connection: Keep-Alive, TE.
TE: deflate, gzip, chunked, identity, trailers.
7.要在每次匹配数据包时以YYYY / MM / DD HH:MM:SS.UUUUUU的形式打印时间戳 ,请使用-t标志。
$ sudo ngrep -t -W byline port 80
interface: enp0s3 (192.168.0.0/255.255.255.0)
filter: ( port 80 ) and ((ip || ip6) || (vlan && (ip || ip6)))
####
T 2018/07/12 16:33:19.348084 192.168.0.104:43048 -> 172.217.160.174:80 [AP]
GET / HTTP/1.1.
Host: google.com.
User-Agent: Links (2.13; Linux 4.17.6-1.el7.elrepo.x86_64 x86_64; GNU C 4.8.5; text).
Accept: */*.
Accept-Language: en,*;q=0.1.
Accept-Encoding: gzip, deflate, bzip2.
Accept-Charset: us-ascii,ISO-8859-1,ISO-8859-2,ISO-8859-3,ISO-8859-4,ISO-8859-5,utf-8.
Connection: keep-alive.
8.为避免将被监视的接口置于混杂模式(截获并读取完整到达的每个网络数据包),请添加-p标志。
$ sudo ngrep -p -W byline port 80
9.另一个重要选项是-N ,在您观察原始或未知协议时非常有用。 它告诉ngrep显示子协议号以及单字符标识符。
$ sudo ngrep -N -W byline
有关更多信息,请参阅ngrep手册页。
$ man ngrep
ngrep Github存储库: https : //github.com/jpr5/ngrep
就这样! Ngrep ( 网络grep )是一个网络数据包分析器,它以相同的方式tcpdump理解BPF过滤器逻辑。 我们想在评论部分了解您对ngrep的看法。