Nagios是用于系统和网络监控的开源软件。 Nagios可以监控主机及其服务的活动,并在服务器发生不良情况时提供警告/警报。 Nagios可以在Linux操作系统上运行。 在这个时候,我正在使用Ubuntu 16.04进行安装。
先决条件
- 2 Ubuntu 16.04 - 64bit服务器
- 1 - Nagios主机IP:192.168.1.9
- 2 - 具有IP的Ubuntu客户端:192.168.1.10
- Root / Sudo访问
我们将在本教程中做什么:
- 软件包依赖关系,如 - LAMP等
- 用户和组配置。
- 安装Nagios。
- 配置Apache
- 测试Nagios服务器。
- 添加主机监控。
安装先决条件
Nagios需要用于编译的gcc编译器和build-essentials,用于Nagios Web界面的LAMP(Apache,PHP,MySQL)和Sendmail从服务器发送警报。 要安装所有这些软件包,请运行此命令(它只是1行):
sudo apt-get install wget build-essential apache2 php apache2-mod-php7.0 php-gd libgd-dev sendmail unzip
用户和组配置
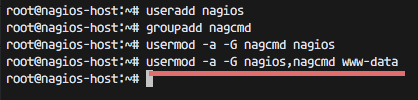
对于Nagios运行,您必须为Nagios创建一个新用户。 我们将命名用户“nagios” ,并另外创建一个名为“nagcmd”的组。 我们将新用户添加到组中,如下所示:
useradd nagios
groupadd nagcmd
usermod -a -G nagcmd nagios
usermod -a -G nagios,nagcmd www-data
安装Nagios
第1步 - 下载并提取Nagios核心
cd ~
wget https://assets.nagios.com/downloads/nagioscore/releases/nagios-4.2.0.tar.gz
tar -xzf nagios*.tar.gz
cd nagios-4.2.0
第2步 - 编译Nagios
在构建Nagios之前,您必须先使用用户和之前创建的组来配置它。
./configure --with-nagios-group=nagios --with-command-group=nagcmd
有关更多信息,请使用: ./configure --help 。
现在安装Nagios:
make all
sudo make install
sudo make install-commandmode
sudo make install-init
sudo make install-config
/usr/bin/install -c -m 644 sample-config/httpd.conf /etc/apache2/sites-available/nagios.conf
并将evenhandler目录复制到nagios目录中:
cp -R contrib/eventhandlers/ /usr/local/nagios/libexec/
chown -R nagios:nagios /usr/local/nagios/libexec/eventhandlers
第3步 - 安装Nagios插件
下载并提取Nagios插件:
cd ~
wget https://nagios-plugins.org/download/nagios-plugins-2.1.2.tar.gz
tar -xzf nagios-plugins*.tar.gz
cd nagios-plugin-2.1.2/
使用以下命令安装Nagios插件:
./configure --with-nagios-user=nagios --with-nagios-group=nagios --with-openssl
make
make install
第4步 - 配置Nagios
安装阶段完成后,您可以在/ usr / local / nagios /中找到Nagios的默认配置。
我们将配置Nagios和Nagios联系人。
使用vim编辑默认的nagios配置:
vim /usr/local/nagios/etc/nagios.cfg
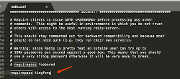
取消注释线路51为主机监视器配置。
cfg_dir=/usr/local/nagios/etc/servers
保存并退出。
添加名为servers的新文件夹:
mkdir -p /usr/local/nagios/etc/servers
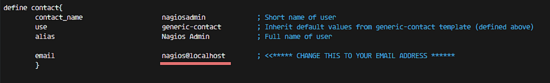
可以在contact.cfg文件中配置Nagios联系人。 打开它使用:
vim /usr/local/nagios/etc/objects/contacts.cfg
然后用您自己的电子邮件替换默认电子邮件。
配置Apache
第1步 - 启用Apache模块
sudo a2enmod rewrite
sudo a2enmod cgi
您可以使用htpasswd命令为nagios Web界面配置用户nagiosadmin
sudo htpasswd -c /usr/local/nagios/etc/htpasswd.users nagiosadmin
并输入密码。
第2步 - 启用Nagios虚拟主机
sudo ln -s /etc/apache2/sites-available/nagios.conf /etc/apache2/sites-enabled/
第3步 - 启动Apache和Nagios
service apache2 restart
service nagios start
当Nagios启动时,您可能会看到以下错误:
Starting nagios (via systemctl): nagios.serviceFailed
这就是如何解决它:
cd /etc/init.d/
cp /etc/init.d/skeleton /etc/init.d/nagios
现在编辑Nagios文件:
vim /etc/init.d/nagios
...并添加以下代码:
DESC="Nagios"
NAME=nagios
DAEMON=/usr/local/nagios/bin/$NAME
DAEMON_ARGS="-d /usr/local/nagios/etc/nagios.cfg"
PIDFILE=/usr/local/nagios/var/$NAME.lock
使其可执行并启动Nagios:
chmod +x /etc/init.d/nagios
service apache2 restart
servuce nagios start
测试Nagios服务器
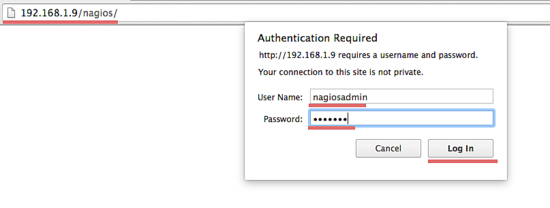
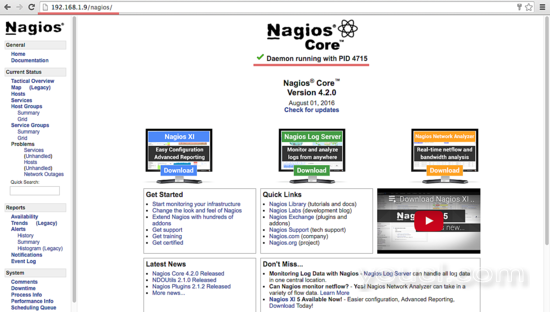
在我的情况下,请打开浏览器并访问Nagios服务器ip: http : //192.168.1.9/nagios 。
Nagios用apache htpasswd登录。
Nagios管理控制板
添加主机监控
在本教程中,我将添加一个Ubuntu主机来监视我们上面提到的Nagios服务器。
Nagios Server IP : 192.168.1.9
Ubuntu Host IP : 192.168.1.10
第1步 - 连接到ubuntu主机
ssh root@192.168.1.10
第2步 - 安装NRPE服务
sudo apt-get install nagios-nrpe-server nagios-plugins
第3步 - 配置NRPE
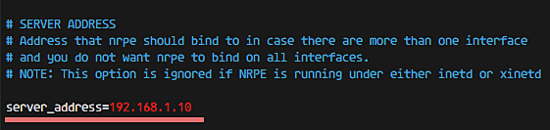
安装完成后,编辑ntpe文件/etc/nagios/nrpe.cfg :
vim /etc/nagios/nrpe.cfg
...并将Nagios Server IP 192.168.1.9添加到server_address 。
server_address = 192.168.1.9
第4步 - 重新启动NRPE
service nagios-nrpe-server restart
第5步 - 将Ubuntu主机添加到Nagios服务器
请连接到Nagios服务器:
ssh root@192.168.1.9
然后为/ usr / local / nagios / etc / servers /中的主机配置创建一个新文件。
vim /usr/local/nagios/etc/servers/ubuntu_host.cfg
添加以下行:
# Ubuntu Host configuration file

define host {
        use                          linux-server
        host_name                    ubuntu_host
        alias                        Ubuntu Host
        address                      192.168.1.10
        register                     1
}

define service {
      host_name                       ubuntu_host
      service_description             PING
      check_command                   check_ping!100.0,20%!500.0,60%
      max_check_attempts              2
      check_interval                  2
      retry_interval                  2
      check_period                    24x7
      check_freshness                 1
      contact_groups                  admins
      notification_interval           2
      notification_period             24x7
      notifications_enabled           1
      register                        1
}

define service {
      host_name                       ubuntu_host
      service_description             Check Users
      check_command           check_local_users!20!50
      max_check_attempts              2
      check_interval                  2
      retry_interval                  2
      check_period                    24x7
      check_freshness                 1
      contact_groups                  admins
      notification_interval           2
      notification_period             24x7
      notifications_enabled           1
      register                        1
}

define service {
      host_name                       ubuntu_host
      service_description             Local Disk
      check_command                   check_local_disk!20%!10%!/
      max_check_attempts              2
      check_interval                  2
      retry_interval                  2
      check_period                    24x7
      check_freshness                 1
      contact_groups                  admins
      notification_interval           2
      notification_period             24x7
      notifications_enabled           1
      register                        1
}

define service {
      host_name                       ubuntu_host
      service_description             Check SSH
      check_command                   check_ssh
      max_check_attempts              2
      check_interval                  2
      retry_interval                  2
      check_period                    24x7
      check_freshness                 1
      contact_groups                  admins
      notification_interval           2
      notification_period             24x7
      notifications_enabled           1
      register                        1
}

define service {
      host_name                       ubuntu_host
      service_description             Total Process
      check_command                   check_local_procs!250!400!RSZDT
      max_check_attempts              2
      check_interval                  2
      retry_interval                  2
      check_period                    24x7
      check_freshness                 1
      contact_groups                  admins
      notification_interval           2
      notification_period             24x7
      notifications_enabled           1
      register                        1
}
您可以在/usr/local/nagios/etc/objects/commands.cfg文件中找到许多check_command 。 如果您想添加更多的服务,如DHCP,POP等,请参阅
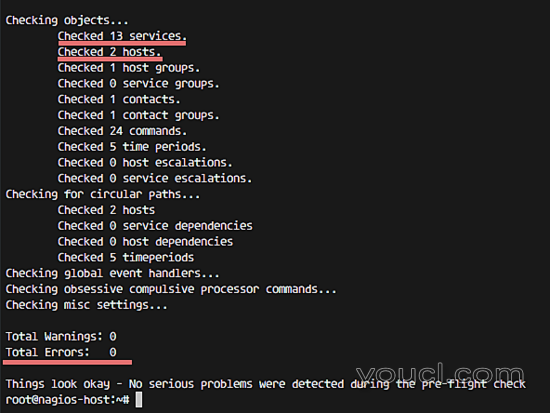
现在检查配置:
/usr/local/nagios/bin/nagios -v /usr/local/nagios/etc/nagios.cfg
...查看配置是否正确。
第6步 - 重新启动所有服务
在Ubuntu主机上启动NRPE服务:
service nagios-nrpe-server restart
...在Nagios服务器上,启动Apache和Nagios:
service apache2 restart
service nagios restart
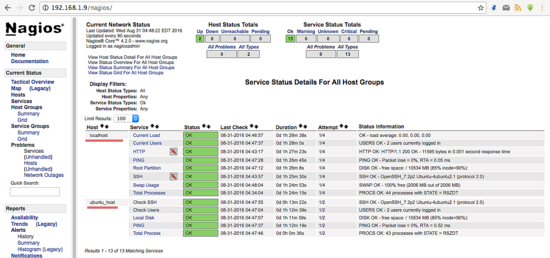
第7步 - 测试Ubuntu主机
从浏览器打开Nagios服务器,并查看受监控的ubuntu_host。
Ubuntu主机在受监控的主机上可用。
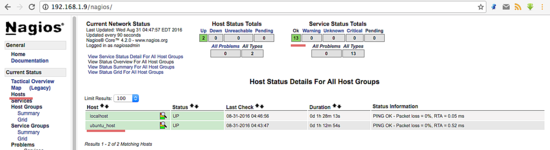
监控所有服务,无错误。
结论
Nagios是用于监视系统的开源应用程序。 Nagios由于易于配置而被广泛使用。 Nagios在各种插件的支持下,甚至可以创建自己的插件。 看这里了解更多信息。