介绍
Monit是一个免费和开源的服务监控应用程序,可以执行各种基于事件的操作。 Monit可以发送电子邮件通知,重新启动服务或应用程序,或采取其他响应措施。
本教程将基于一个基本的LEMP(Linux,Nginx,MySQL,PHP)。 Monit将被并入以监视中的所有服务,并向根用户警告任何不利条件。
可选的外部Monit服务器也可用于远程监控Web应用程序或其他服务。
先决条件
- 在我们开始之前,你首先需要设置一个Ubuntu 14.04 Droplet
- 你需要有一个标准用户帐户sudo的权限
- 本教程将Monit添加到现有的LEMP中。 有关如何创建初始LEMP的教程,请参阅如何在Ubuntu 14.04安装Linux,nginx的,MySQL和PHP(LEMP)
- 可选:如果要监视远程网站,DNS或邮件服务器,则应使该服务器设置为具有可公开访问的域或IP地址(第6步中的更多内容)
第1步 - 配置Monit通知的电子邮件传递
系统监控的一部分通常涉及用于警报的电子邮件通知。 因此,正确的电子邮件递送必须到位,以便Monit发送电子邮件通知。 典型的Monit警报电子邮件将类似于此:
From: monit@example.com
To: root@yourserver.com

Resource limit matched Service example.com

        Date:        Mon, 22 Dec 2014 03:04:06
        Action:      alert
        Host:        example.com
        Description: cpu user usage of 79.8% matches resource limit [cpu user usage>70.0%]

Your faithful employee,
Monit
本教程将设置Monit,以便在每次触发警报时向您发送电子邮件。
注:monit的的通知,可能会去到垃圾邮件文件夹在默认情况下。 反向DNS(称为PTR记录)必须正确配置,以确保最高的机会邮件将成功传递。 您Droplet的主机名必须完全限定域名(FQDN)相匹配,因此,例如,他们可以同时为hostname.example.com。 要编辑DigitalOcean Droplet的PTR记录,请访问DigitalOcean控制面板。 导航到设置 ,选择重命名选项卡。 输入新的主机名,然后单击重命名 。
本指南假设您没有预先存在的邮件传输代理(MTA),因此我们将安装Postfix。 本地安装的Postfix允许系统发送通知电子邮件到外部邮件提供商,如Gmail或雅虎。
要开始安装Postfix作为您的MTA,首先更新系统的存储库源列表。
sudo apt-get update
然后从Ubuntu的存储库安装Postfix和GNU Mailutils软件包。
sudo apt-get install postfix mailutils
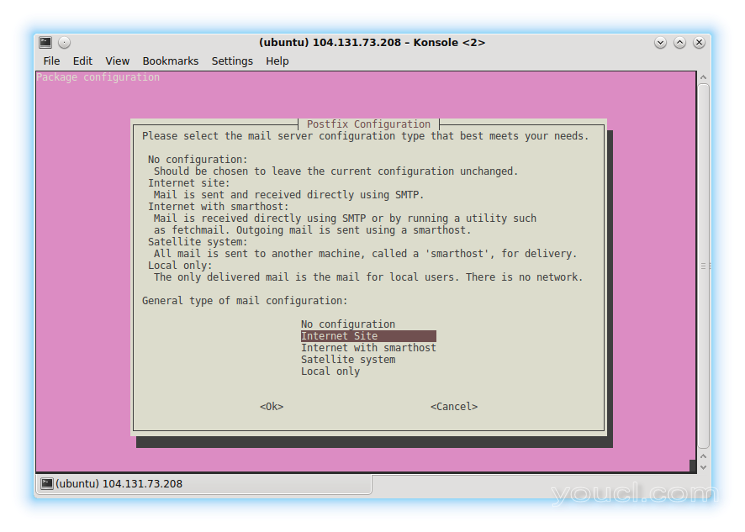
在安装结束时,将提示您选择服务器配置类型,如下面的屏幕截图所示。 选择互联网站点 。
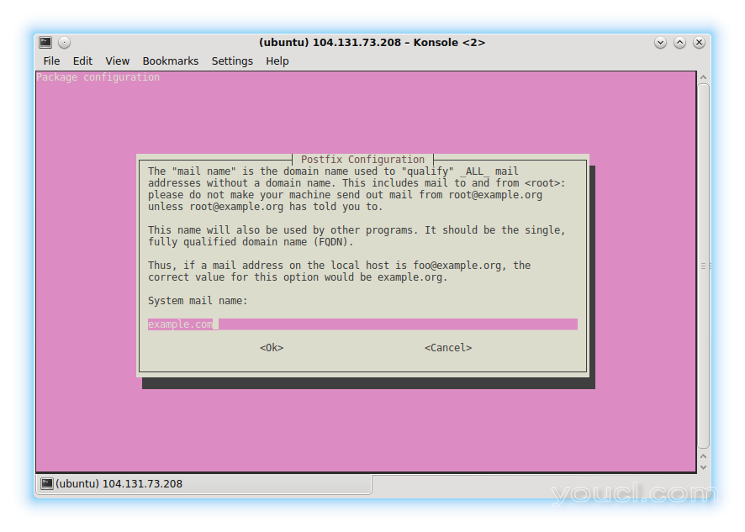
当提示系统邮件名称 ,用你的Droplet的完全限定域名(FQDN) 注:系统邮件名称也可以在后来改/etc/mailname 。
接下来,打开文件/ etc / aliases文件进行编辑。 本指南将使用Nano,但您可以使用任何您喜欢的文本编辑器。
sudo nano /etc/aliases
在这里,我们将添加一个个人电子邮件地址,我们将收到Monit的通知电子邮件。 这些邮件通知将来自我们的LEMP服务器的root用户。
postmaster: root
root: myemail@gmail.com
如果需要,还可以添加多个目的地:
root: username, itstaff@mycompany.com, otherperson@other.com
保存更改并退出Nano。 然后运行以下命令来更新别名文件:
sudo newaliases
可以从Droplet发送测试消息以检查邮件传递。 如果您的收件箱中未首先显示测试邮件,请检查垃圾邮件文件夹。
echo test | mail -s "test message from my VPS" root
第2步 - 安装和配置Monit
Monit也可以在Ubuntu包库中使用。 有关monit的一个简短的参考指南,请参阅本教程 。
Monit可以安装在您的LEMP服务器上:
sudo apt-get install monit
在Ubuntu 14.04中,monit的配置文件位于/ etc / monit的/和主要monit的配置文件是/etc/monit/monitrc 。
在纳米打开monitrc编辑:
sudo nano /etc/monit/monitrc
取消注释以下行并将其更改为下面显示的行:
set mailserver localhost  #Use localhost for email alert delivery.

set mail-format {
      from: monit@$HOST
   subject: monit alert --  $EVENT $SERVICE
   message: $EVENT Service $SERVICE
                 Date:        $DATE
                 Action:      $ACTION
                 Host:        $HOST
                 Description: $DESCRIPTION

            Your faithful employee,
            Monit
}

set alert root@localhost not on { instance, action }  #Set email address to receive alerts. This guide uses root mail.
仍然在monitrc文件,现在取消以下行并更改example.com以匹配您的服务器的域名或IP地址。
check system example.com
    if loadavg (1min) > 4 then alert
    if loadavg (5min) > 2 then alert
    if memory usage > 75% then alert
    if swap usage > 25% then alert
    if cpu usage (user) > 70% then alert
    if cpu usage (system) > 30% then alert
    if cpu usage (wait) > 20% then alert
我们还将在文件的末尾添加此条目:
check filesystem rootfs with path / #Alert if low on disk space.
    if space usage > 90% then alert
保存更改并退出Nano。
第3步 - 在Monit中为LEMP服务配置服务监控
在Ubuntu 14.04,monit的配置可以直接在指定/etc/monit/monitrc文件或通过在单个文件/etc/monit/conf.d/ 。 在本教程中,单个文件将下创建/etc/monit/conf.d/目录。
首先,我们将向Monit提供管理服务的方法。 为简单起见本教程的缘故,我们把所有的过程监控到位于一个单独的文件/etc/monit/conf.d/lemp-services 。 使用以下条目,Monit将观看Nginx,MySQL和PHP-FPM,如果由于任何原因异常停止,则重新启动这些服务。
我们可以用Nano创建工作文件:
sudo nano /etc/monit/conf.d/lemp-services
为我们的LEMP中的服务添加以下条目:
check process nginx with pidfile /var/run/nginx.pid
    group www-data
    start program = "/etc/init.d/nginx start"
    stop program = "/etc/init.d/nginx stop"

check process mysql with pidfile /var/run/mysqld/mysqld.pid
    start program = "/etc/init.d/mysql start"
    stop program = "/etc/init.d/mysql stop"

check process php5-fpm with pidfile /var/run/php5-fpm.pid
    start program = "/etc/init.d/php5-fpm start"
    stop program = "/etc/init.d/php5-fpm stop"
然后保存您的更改。
第4步 - 添加重新启动不健康的LEMP服务的操作
现在Monit能够管理选择服务,可以添加操作以根据需要重新启动服务。 例如,Monit具有监视TCP连接的能力。 如果服务器不再证明HTTP连接,Monit可以重新启动PHP-FPM或Nginx来自动解决问题。
为了巩固我们现有的配置,我们将正进一步修改/etc/monit/conf.d/lemp-services 。 我们将在下面进行添加,显示为红色 ,我们会告诉monit的重启Nginx的和PHP-FPM如果HTTP连接不再可用。 此外,如果套接字不可用,我们将使Monit重新启动MySQL。
注:请务必使用在那里你看到example.com在第一和第三项的Droplet的域名或IP地址。
check process nginx with pidfile /var/run/nginx.pid
    group www-data
    start program = "/etc/init.d/nginx start"
    stop program = "/etc/init.d/nginx stop"
    if failed host example.com port 80 protocol http then restart
    if 5 restarts within 5 cycles then timeout

check process mysql with pidfile /var/run/mysqld/mysqld.pid
    start program = "/etc/init.d/mysql start"
    stop program = "/etc/init.d/mysql stop"
    if failed unixsocket /var/run/mysqld/mysqld.sock then restart
    if 5 restarts within 5 cycles then timeout

check process php5-fpm with pidfile /var/run/php5-fpm.pid
    start program = "/etc/init.d/php5-fpm start"
    stop program = "/etc/init.d/php5-fpm stop"
    if failed host example.com port 80 protocol http then restart
    if 5 restarts within 5 cycles then timeout
保存您的更改并关闭Nano。 然后重新启动Monit以应用您迄今为止所做的配置更改。
sudo service monit restart
第5步(可选) - 监视错误和关键字的日志
Monit还可以监视特定关键字的日志,然后执行操作或发送警报。 这在Web应用程序遇到问题或团队需要从日志中通知特定追溯或事件的情况下很有用。
以下是Monit可以监视的超时错误的Nginx日志示例,并提醒:
2014/12/22 11:03:54 [error] 21913#0: *202571 upstream timed out (110: Connection timed out) while reading response header from upstream, client: 2600:3c01::f03c:91ff:fe6e:5a91, server: example.com, request: "GET /wp-admin/admin-ajax.php?action=wordfence_doScan&isFork=1&cronKey=40cb51ccsdfsf322fs35 HTTP/1.0", upstream: "fastcgi://unix:/var/run/example.com.sock", host: "example.com"
基于我们现有的配置,在Nano中再次打开您的LEMP服务配置文件。
sudo nano /etc/monit/conf.d/lemp-services
添加以下条目。 当任何超时发生从Nginx与PHP-FPM通信时,这将发送通知。
check file nginx-error with path /var/log/nginx/error.log
    if match "^timed out" then alert
保存您的更改并关闭Nano。 然后重新启动Monit以使更改生效:
sudo service monit restart
第6步(可选) - 使用Monit监控远程网站和其他服务
除了在本地使用Monit外,Monit还可以观看各种外部服务和连接。 在本例中,我们将使用我们已经设置的Monit的本地实例,并为外部服务添加一些新的监视配置。
优选在完全不同的数据中心中具有用于带外目的的外部Monit系统。 如果一个web应用程序基于纽约,在旧金山有一个小的外部Monit服务器将是理想的。
下面是可以在运行Monit的第二台主机上实现的外部Monit检查的示例。 这些实施例将被放置在外部服务器的/etc/monit/conf.d/lemp-external文件进行远程检查我们在remote-example.com LEMP栈。
使用Nano创建此配置文件:
sudo nano /etc/monit/conf.d/lemp-external
监控ICMP响应和HTTP和HTTPS连接:
# ICMP check
check host remote-example.com with address remote-example.com
    if failed icmp type echo
        for 5 times within 5 cycles
        then alert

# HTTP check
    if failed
          port 80 protocol http
       for 5 times within 5 cycles
       then alert

# HTTPS check
    if failed
          port 443 type tcpSSL protocol http
       for 5 times within 5 cycles
       then alert
监视DNS:
check host ns1.example.com with address ns1.example.com
    if failed port 53 type udp protocol dns then alert
监视SMTP:
check host smtp.example.com with address smtp.example.com
    if failed port 25 type tcp protocol smtp then alert
监视Web应用程序的Healthcheck URL
对于Web应用程序,Monit还可以对健康检查URL执行特定请求。 下面是一个网站remote-example.com具有的健康检查URL的一个例子: https://remote-example.com/healthcheck 。
check host remote-example.com with address remote-example.com
    if failed
          port 443 type tcpSSL protocol http
       request "/healthcheck"
       for 5 times within 5 cycles
       then alert
第7步 - 从命令行管理监视
Monit也提供了命令行实用程序。 从那里,简单的命令可以用于检查整体Monit状态和完成有用的任务,如临时启动或停止监控。
为了从命令行运行Monit状态检查,必须启用Monit Web服务。 要做到这一点,开放/etc/monit/monitrc在纳米编辑。
sudo nano /etc/monit/monitrc
取消注释以下行以在本地启用Web服务:
set httpd port 2812 and
        use address localhost
        allow localhost
保存更改并退出Nano。 然后重新启动Monit:
sudo service monit restart
现在可以从命令行检查Monit的状态。
以下是临时禁用和启用监视的命令:
sudo monit unmonitor all

sudo monit monitor all
第8步 - 查看报告
让我们来看看我们已经设置的所有检查的报告。
sudo monit status
现在,您将看到配置Monit检查的所有内容的输出,包括本地LEMP服务和任何外部检查:
sudo monit status
The Monit daemon 5.6 uptime: 0m

System 'example.com'
  status                            Running
  monitoring status                 Monitored
  load average                      [0.00] [0.01] [0.05]
  cpu                               0.5%us 0.4%sy 0.0%wa
  memory usage                      115132 kB [22.9%]
  swap usage                        0 kB [0.0%]
  data collected                    Mon, 22 Dec 2014 16:50:42

Filesystem 'rootfs'
  status                            Accessible
  monitoring status                 Monitored
  permission                        755
  uid                               0
  gid                               0
  filesystem flags                  0x1000
  block size                        4096 B
  blocks total                      5127839 [20030.6 MB]
  blocks free for non superuser     4315564 [16857.7 MB] [84.2%]
  blocks free total                 4581803 [17897.7 MB] [89.4%]
  inodes total                      1310720
  inodes free                       1184340 [90.4%]
  data collected                    Mon, 22 Dec 2014 16:50:42

Process 'nginx'
  status                            Running
  monitoring status                 Monitored
  pid                               14373
  parent pid                        1
  uptime                            28m
  children                          4
  memory kilobytes                  1364
  memory kilobytes total            9228
  memory percent                    0.2%
  memory percent total              1.8%
  cpu percent                       0.0%
  cpu percent total                 0.0%
  port response time                0.018s to example.com:80 [HTTP via TCP]
  data collected                    Mon, 22 Dec 2014 16:50:42

Process 'mysql'
  status                            Running
  monitoring status                 Monitored
  pid                               12882
  parent pid                        1
  uptime                            32m
  children                          0
  memory kilobytes                  44464
  memory kilobytes total            44464
  memory percent                    8.8%
  memory percent total              8.8%
  cpu percent                       0.0%
  cpu percent total                 0.0%
  unix socket response time         0.000s to /var/run/mysqld/mysqld.sock [DEFAULT]
  data collected                    Mon, 22 Dec 2014 16:50:42

Process 'php5-fpm'
  status                            Running
  monitoring status                 Monitored
  pid                               17033
  parent pid                        1
  uptime                            0m
  children                          2
  memory kilobytes                  13836
  memory kilobytes total            22772
  memory percent                    2.7%
  memory percent total              4.5%
  cpu percent                       0.0%
  cpu percent total                 0.0%
  port response time                0.018s to example.com:80 [HTTP via TCP]
  data collected                    Mon, 22 Dec 2014 16:50:42

File 'nginx-error'
  status                            Accessible
  monitoring status                 Monitored
  permission                        644
  uid                               0
  gid                               0
  timestamp                         Mon, 22 Dec 2014 16:18:21
  size                              0 B
  data collected                    Mon, 22 Dec 2014 16:50:42

Remote Host 'example.com'
  status                            Online with all services
  monitoring status                 Monitored
  icmp response time                0.021s [Echo Request]
  port response time                0.107s to example.com:443 [HTTP via TCPSSL]
  port response time                0.062s to example.com:80 [HTTP via TCP]
  data collected                    Mon, 22 Dec 2014 16:50:42
使用此数据来检查服务的运行状况并查看有用的统计信息。
故障排除
如果出现任何问题,请首先检查位于monit的的日志/var/log/monit.log 。 这将为您提供有关问题性质的更多信息。
错误日志条目示例:
[UTC Dec 22 13:59:54] error    : ICMP echo response for example.com 1/3 timed out -- no response within 5 seconds
[UTC Dec 22 14:10:16] error    : ICMP echo response for example.com 1/3 timed out -- no response within 5 seconds
[UTC Dec 22 15:24:19] error    : 'example.com' failed protocol test [HTTP] at INET[example.com:80] via TCP -- HTTP: Error receiving data -- Resource temporarily unavailable
[UTC Dec 22 15:57:15] error    : ICMP echo response for example.com 1/3 timed out -- no response within 5 seconds
[UTC Dec 22 17:00:57] error    : ICMP echo response for example.com 1/3 timed out -- no response within 5 seconds
[UTC Dec 22 17:49:00] error    : 'example.com' failed, cannot open a connection to INET[example.com:443/API] via TCPSSL
结论
完成本指南后,您应该已经将Monit配置为在Ubuntu 14.04上监视LEMP。 Monit是相当可扩展的,可以很容易地定制或扩展,用于监控小型和大型网络的各种服务。
以下是Monit的一些其他链接: