20用于Linux监视的Sysstat命令
mpstat - 处理器统计
1.使用mpstat命令没有任何选项,将所有CPU显示全球平均水平的活动。youcl@youcl ~ $ mpstat Linux 3.11.0-23-generic (youcl.com) Thursday 04 September 2014 _i686_ (2 CPU) 12:23:57 IST CPU %usr %nice %sys %iowait %irq %soft %steal %guest %gnice %idle 12:23:57 IST all 37.35 0.01 4.72 2.96 0.00 0.07 0.00 0.00 0.00 54.882.使用与选择mpstat的 “-P”(注明处理器编号)和“ALL”,将显示一个所有的CPU以上统计学从0 0将第一个开始。
youcl@youcl ~ $ mpstat -P ALL Linux 3.11.0-23-generic (youcl.com) Thursday 04 September 2014 _i686_ (2 CPU) 12:29:26 IST CPU %usr %nice %sys %iowait %irq %soft %steal %guest %gnice %idle 12:29:26 IST all 37.33 0.01 4.57 2.58 0.00 0.07 0.00 0.00 0.00 55.44 12:29:26 IST 0 37.90 0.01 4.96 2.62 0.00 0.03 0.00 0.00 0.00 54.48 12:29:26 IST 1 36.75 0.01 4.19 2.54 0.00 0.11 0.00 0.00 0.00 56.403.要经过n秒的时间间隔显示 N个迭代统计与每个CPU的平均使用下面的命令。
youcl@youcl ~ $ mpstat -P ALL 2 5 Linux 3.11.0-23-generic (youcl.com) Thursday 04 September 2014 _i686_ (2 CPU) 12:36:21 IST CPU %usr %nice %sys %iowait %irq %soft %steal %guest %gnice %idle 12:36:23 IST all 53.38 0.00 2.26 0.00 0.00 0.00 0.00 0.00 0.00 44.36 12:36:23 IST 0 46.23 0.00 1.51 0.00 0.00 0.00 0.00 0.00 0.00 52.26 12:36:23 IST 1 60.80 0.00 3.02 0.00 0.00 0.00 0.00 0.00 0.00 36.18 12:36:23 IST CPU %usr %nice %sys %iowait %irq %soft %steal %guest %gnice %idle 12:36:25 IST all 34.18 0.00 2.30 0.00 0.00 0.00 0.00 0.00 0.00 63.52 12:36:25 IST 0 31.63 0.00 1.53 0.00 0.00 0.00 0.00 0.00 0.00 66.84 12:36:25 IST 1 36.73 0.00 2.55 0.00 0.00 0.00 0.00 0.00 0.00 60.71 12:36:25 IST CPU %usr %nice %sys %iowait %irq %soft %steal %guest %gnice %idle 12:36:27 IST all 33.42 0.00 5.06 0.25 0.00 0.25 0.00 0.00 0.00 61.01 12:36:27 IST 0 34.34 0.00 4.04 0.00 0.00 0.00 0.00 0.00 0.00 61.62 12:36:27 IST 1 32.82 0.00 6.15 0.51 0.00 0.00 0.00 0.00 0.00 60.514.选择“ 我 ”,将打印每个处理器的中断统计总数。
youcl@youcl ~ $ mpstat -I Linux 3.11.0-23-generic (youcl.com) Thursday 04 September 2014 _i686_ (2 CPU) 12:39:56 IST CPU intr/s 12:39:56 IST all 651.04 12:39:56 IST CPU 0/s 1/s 6/s 8/s 9/s 12/s 16/s 17/s 20/s 21/s 22/s 23/s 45/s 46/s 47/s NMI/s LOC/s SPU/s PMI/s IWI/s RTR/s RES/s CAL/s TLB/s TRM/s THR/s MCE/s MCP/s ERR/s MIS/s 12:39:56 IST 0 76.27 1.73 0.00 0.00 0.42 0.33 0.00 0.06 11.46 0.00 0.00 0.01 7.62 1.87 0.05 0.33 182.26 0.00 0.33 3.03 0.00 22.66 0.16 5.14 0.00 0.00 0.00 0.00 0.00 0.00 12:39:56 IST 1 70.88 1.44 0.00 0.00 0.41 0.33 0.00 27.91 10.33 0.00 0.00 0.01 7.27 1.79 0.05 0.32 184.11 0.00 0.32 5.17 0.00 22.09 0.13 4.73 0.00 0.00 0.00 0.00 0.00 0.00 12:39:56 IST CPU HI/s TIMER/s NET_TX/s NET_RX/s BLOCK/s BLOCK_IOPOLL/s TASKLET/s SCHED/s HRTIMER/s RCU/s 12:39:56 IST 0 0.00 116.49 0.05 0.27 7.33 0.00 1.22 10.44 0.13 37.47 12:39:56 IST 1 0.00 111.65 0.05 0.41 7.07 0.00 56.36 9.97 0.13 41.385.在获取一条命令,即相当于 “-u -I ALL -P ALL”的所有上述信息。
youcl@youcl ~ $ mpstat -A
Linux 3.11.0-23-generic (youcl.com) 	Thursday 04 September 2014 	_i686_	(2 CPU)
12:41:39  IST  CPU    %usr   %nice    %sys %iowait    %irq   %soft  %steal  %guest  %gnice   %idle
12:41:39  IST  all   38.70    0.01    4.47    2.01    0.00    0.06    0.00    0.00    0.00   54.76
12:41:39  IST    0   39.15    0.01    4.82    2.05    0.00    0.02    0.00    0.00    0.00   53.95
12:41:39  IST    1   38.24    0.01    4.12    1.98    0.00    0.09    0.00    0.00    0.00   55.57
12:41:39  IST  CPU    intr/s
12:41:39  IST  all    651.73
12:41:39  IST    0    173.16
12:41:39  IST    1    225.89
12:41:39  IST  CPU        0/s        1/s        6/s        8/s        9/s       12/s       16/s       17/s       20/s       21/s       22/s       23/s       45/s       46/s       47/s      NMI/s      LOC/s      SPU/s      PMI/s      IWI/s      RTR/s      RES/s      CAL/s      TLB/s      TRM/s      THR/s      MCE/s      MCP/s      ERR/s      MIS/s
12:41:39  IST    0      76.04       1.77       0.00       0.00       0.41       0.36       0.00       0.06      11.60       0.00       0.00       0.01       7.42       1.83       0.05       0.34     182.89       0.00       0.34       2.97       0.00      22.69       0.16       5.22       0.00       0.00       0.00       0.00       0.00       0.00
12:41:39  IST    1      70.70       1.48       0.00       0.00       0.40       0.36       0.00      27.47      10.46       0.00       0.00       0.01       7.08       1.75       0.05       0.32     184.83       0.00       0.32       5.10       0.00      22.19       0.13       4.91       0.00       0.00       0.00       0.00       0.00       0.00
12:41:39  IST  CPU       HI/s    TIMER/s   NET_TX/s   NET_RX/s    BLOCK/s BLOCK_IOPOLL/s  TASKLET/s    SCHED/s  HRTIMER/s      RCU/s
12:41:39  IST    0       0.00     116.96       0.05       0.26       7.12       0.00       1.24      10.42       0.12      36.99
12:41:39  IST    1       0.00     112.25       0.05       0.40       6.88       0.00      55.05       9.93       0.13      41.20
pidstat - 进程和内核线程统计
这用于进程监视和当前线程,由内核管理。 pidstat也可以检查子进程和线程的状态。句法
# pidstat <OPTIONS> [INTERVAL] [COUNT]6.使用pidstat命令不带任何参数,将显示所有活动任务。
youcl@youcl ~ $ pidstat Linux 3.11.0-23-generic (youcl.com) Thursday 04 September 2014 _i686_ (2 CPU) 12:47:24 IST UID PID %usr %system %guest %CPU CPU Command 12:47:24 IST 0 1 0.01 0.12 0.00 0.13 1 init 12:47:24 IST 0 3 0.00 0.01 0.00 0.01 0 ksoftirqd/0 12:47:24 IST 0 9 0.00 0.04 0.00 0.04 0 rcu_sched 12:47:24 IST 0 10 0.00 0.00 0.00 0.00 0 watchdog/0 12:47:24 IST 0 11 0.00 0.00 0.00 0.00 1 watchdog/1 12:47:24 IST 0 12 0.00 0.00 0.00 0.00 1 migration/1 12:47:24 IST 0 13 0.00 0.01 0.00 0.01 1 ksoftirqd/1 12:47:24 IST 0 23 0.00 0.00 0.00 0.00 0 kworker/u9:0 12:47:24 IST 0 29 0.00 0.61 0.00 0.61 0 kworker/0:1 12:47:24 IST 0 30 0.00 0.06 0.00 0.06 1 kworker/1:1 12:47:24 IST 0 224 0.00 0.01 0.00 0.01 1 jbd2/sda1-8 12:47:24 IST 0 360 0.00 0.00 0.00 0.00 1 upstart-udev-br 12:47:24 IST 0 365 0.01 0.00 0.00 0.01 0 systemd-udevd 12:47:24 IST 0 476 0.00 0.00 0.00 0.00 0 kworker/u9:17.要打印的所有活动和非活动任务使用的选项 “-p”(进程)。
youcl@youcl ~ $ pidstat -p ALL Linux 3.11.0-23-generic (youcl.com) Thursday 04 September 2014 _i686_ (2 CPU) 12:51:55 IST UID PID %usr %system %guest %CPU CPU Command 12:51:55 IST 0 1 0.01 0.11 0.00 0.12 1 init 12:51:55 IST 0 2 0.00 0.00 0.00 0.00 0 kthreadd 12:51:55 IST 0 3 0.00 0.01 0.00 0.01 0 ksoftirqd/0 12:51:55 IST 0 5 0.00 0.00 0.00 0.00 0 kworker/0:0H 12:51:55 IST 0 7 0.00 0.00 0.00 0.00 0 migration/0 12:51:55 IST 0 8 0.00 0.00 0.00 0.00 0 rcu_bh 12:51:55 IST 0 9 0.00 0.04 0.00 0.04 1 rcu_sched 12:51:55 IST 0 10 0.00 0.00 0.00 0.00 0 watchdog/0 12:51:55 IST 0 11 0.00 0.00 0.00 0.00 1 watchdog/1 12:51:55 IST 0 12 0.00 0.00 0.00 0.00 1 migration/1 12:51:55 IST 0 13 0.00 0.01 0.00 0.01 1 ksoftirqd/1 12:51:55 IST 0 15 0.00 0.00 0.00 0.00 1 kworker/1:0H 12:51:55 IST 0 16 0.00 0.00 0.00 0.00 1 khelper 12:51:55 IST 0 17 0.00 0.00 0.00 0.00 0 kdevtmpfs 12:51:55 IST 0 18 0.00 0.00 0.00 0.00 0 netns 12:51:55 IST 0 19 0.00 0.00 0.00 0.00 0 writeback 12:51:55 IST 0 20 0.00 0.00 0.00 0.00 1 kintegrityd8.使用pidstat命令 “-d 2'选项,我们可以得到I / O统计数据和 2是在几秒钟的时间间隔来获得刷新的统计数据。此选项可以方便地在您的系统正在进行繁重的I / O,并且您想要获得关于消耗高资源的进程的线索。
youcl@youcl ~ $ pidstat -d 2 Linux 3.11.0-23-generic (youcl.com) Thursday 04 September 2014 _i686_ (2 CPU) 03:26:53 EDT PID kB_rd/s kB_wr/s kB_ccwr/s Command 03:26:55 EDT PID kB_rd/s kB_wr/s kB_ccwr/s Command 03:26:57 EDT 574 0.00 148.00 2.00 miniserv.pl 03:27:01 EDT PID kB_rd/s kB_wr/s kB_ccwr/s Command 03:27:03 EDT 1 0.00 8.00 2.00 init 03:27:03 EDT 450 0.00 2.00 0.00 rsyslogd 03:27:03 EDT 534 138.00 10.00 4.00 crond 03:27:03 EDT 25100 0.00 6.00 0.00 sendmail 03:27:03 EDT 30829 0.00 6.00 0.00 java9.要知道CPU统计数据与 2秒间隔约进程id 4164的所有线程 3次一起使用带有选项 '-t'(选定的过程中显示的统计数据)以下命令。
youcl@youcl ~ $ pidstat -t -p 4164 2 3 Linux 3.11.0-23-generic (youcl.com) Thursday 04 September 2014 _i686_ (2 CPU) 01:09:06 IST UID TGID TID %usr %system %guest %CPU CPU Command 01:09:08 IST 1000 4164 - 22.00 1.00 0.00 23.00 1 firefox 01:09:08 IST 1000 - 4164 20.00 0.50 0.00 20.50 1 |__firefox 01:09:08 IST 1000 - 4171 0.00 0.00 0.00 0.00 0 |__Gecko_IOThread 01:09:08 IST 1000 - 4172 0.00 0.00 0.00 0.00 0 |__Socket 01:09:08 IST 1000 - 4173 0.00 0.00 0.00 0.00 0 |__JS 01:09:08 IST 1000 - 4174 0.00 0.00 0.00 0.00 0 |__JS 01:09:08 IST 1000 - 4175 0.00 0.00 0.00 0.00 0 |__Hang 01:09:08 IST 1000 - 4176 0.00 0.00 0.00 0.00 1 |__gdbus 01:09:08 IST 1000 - 4177 0.00 0.00 0.00 0.00 1 |__gmain10.使用 “-RH'选项,了解有关内存使用率这是经常改变它们利用 2秒的间隔过程。
youcl@youcl ~ $ pidstat -rh 2 3 Linux 3.11.0-23-generic (youcl.com) Thursday 04 September 2014 _i686_ (2 CPU) # Time UID PID minflt/s majflt/s VSZ RSS %MEM Command 1409816695 1000 3958 3378.22 0.00 707420 215972 5.32 cinnamon 1409816695 1000 4164 406.93 0.00 1252024 461404 11.36 firefox 1409816695 1000 6676 168.81 0.00 4436 984 0.02 pidstat # Time UID PID minflt/s majflt/s VSZ RSS %MEM Command 1409816697 0 1601 644.00 0.00 506728 316788 7.80 Xorg 1409816697 1000 3958 3412.00 0.00 707420 215972 5.32 cinnamon 1409816697 1000 4164 2667.00 0.00 1259576 471724 11.62 firefox 1409816697 1000 6676 172.50 0.00 4436 1020 0.03 pidstat # Time UID PID minflt/s majflt/s VSZ RSS %MEM Command 1409816699 0 1601 644.00 0.00 506728 316788 7.80 Xorg 1409816699 1000 3958 4094.00 0.00 710148 218700 5.39 cinnamon 1409816699 1000 4164 599.00 0.00 1261944 476664 11.74 firefox 1409816699 1000 6676 168.00 0.00 4436 1020 0.03 pidstat11.要打印包含字符串 “VB”的所有过程中,使用 '-t'选项来看看线程为好。
youcl@youcl ~ $ pidstat -G VB
Linux 3.11.0-23-generic (youcl.com) 	Thursday 04 September 2014 	_i686_	(2 CPU)
01:09:06  IST   UID      PID      %usr 	%system  %guest    %CPU   CPU  	Command
01:09:08  IST  1000    1492     22.00     1.00    	 0.00   	 23.00     1  		VBoxService
01:09:08  IST  1000    1902     4164      20.00    	 0.50    	 0.00   	20.50     	VBoxClient
01:09:08  IST  1000    1922     4171      0.00    	 0.00    	 0.00    	0.00     	VBoxClient
youcl@youcl ~ $ pidstat -t -G VB Linux 2.6.32-431.el6.i686 (youcl) 09/04/2014 _i686_ (2 CPU) 03:19:52 PM UID TGID TID %usr %system %guest %CPU CPU Command 03:19:52 PM 0 1479 - 0.01 0.12 0.00 0.13 1 VBoxService 03:19:52 PM 0 - 1482 0.00 0.00 0.00 0.00 0 |__timesync 03:19:52 PM 0 - 1483 0.01 0.06 0.00 0.06 0 |__vminfo 03:19:52 PM 0 - 1485 0.00 0.01 0.00 0.01 1 |__memballoon 03:19:52 PM 0 - 1486 0.00 0.01 0.00 0.01 1 |__vmstats 03:19:52 PM 0 - 1487 0.00 0.05 0.00 0.05 0 |__automount 03:19:52 PM 0 1913 - 0.00 0.00 0.00 0.00 0 VBoxClient 03:19:52 PM 0 - 1913 0.00 0.00 0.00 0.00 0 |__VBoxClient 03:19:52 PM 0 - 1942 0.00 0.00 0.00 0.00 0 |__SHCLIP 03:19:52 PM 0 1933 - 0.04 0.89 0.00 0.93 0 VBoxClient 03:19:52 PM 0 - 1936 0.04 0.89 0.00 0.93 1 |__X11-NOTIFY12.要获取实时优先级和调度信息的使用选项 '-R'。
youcl@youcl ~ $ pidstat -R
Linux 3.11.0-23-generic (youcl.com) 	Thursday 04 September 2014 	_i686_	(2 CPU)
01:09:06  IST   UID      PID	 prio      policy 	Command
01:09:08  IST  1000    3     	 99	       FIFO		migration/0
01:09:08  IST  1000    5     	 99          FIFO	migration/0
01:09:08  IST  1000    6    	 99          FIFO	watchdog/0
在这里,我不会谈论Iostat实用程序,因为我们已经覆盖它。请对“一看 讨论vmstat和iostat Linux的性能监控 ”,以获取有关iostat的所有细节。
sar - 系统活动记录
使用“ 特区 ”的命令,我们可以得到关于整个系统的性能的报告。这可以帮助我们找到系统瓶颈,并提供帮助,找到解决这些恼人的性能问题的解决方案。 Linux内核在内部维护一些计数器,它跟踪所有请求,它们的完成时间和I / O块计数等。从所有这些信息,sar计算这些请求的速率和比率,以找出瓶颈区域。 关于sar的主要事情是,它报告一段时间内的所有活动,如果时间。所以,确保sar在适当的时间收集数据(不是在午餐时间或周末:)。 13.下面是一个基本命令调用特区。 这将创建在当前目录中名为 “sarfile”一个文件。 选项 '-u'是CPU细节,将在 2秒的时间间隔收集 5个报告。youcl@youcl ~ $ sar -u -o sarfile 2 5 Linux 3.11.0-23-generic (youcl.com) Thursday 04 September 2014 _i686_ (2 CPU) 01:42:28 IST CPU %user %nice %system %iowait %steal %idle 01:42:30 IST all 36.52 0.00 3.02 0.00 0.00 60.45 01:42:32 IST all 43.32 0.00 5.04 0.00 0.00 51.64 01:42:34 IST all 56.46 0.00 4.05 0.00 0.00 39.49 01:42:36 IST all 44.44 0.00 3.79 0.00 0.00 51.77 01:42:38 IST all 50.75 0.00 3.75 0.00 0.00 45.50 Average: all 46.30 0.00 3.93 0.00 0.00 49.7714.在上面的例子中,我们以交互方式调用SAR。 我们也有一个选项,通过cron使用脚本 在/ usr / local / lib目录/ SA1和 / usr / local / lib目录/ SA2调用它以非交互方式(如果你在安装时使用 的/ usr / local作为前缀)。
- 在/ usr / local / lib目录/ SA1是一个shell脚本,我们可以使用cron的计划,这将创造每天二进制日志文件。
- 在/ usr / local / lib目录/ SA2是一个shell脚本会改变二进制日志文件,以人类可读的形式。
# Run sa1 shell script every 10 minutes for collecting data
*/2 * * * * /usr/local/lib/sa/sa1 2 10
# Generate a daily report in human readable format at 23:53
53 23 * * * /usr/local/lib/sa/sa2 -A
在后端SA1脚本将调用 南部非洲发展共同体 (系统活动数据收集)实用程序,用于在特定的时间间隔获取数据 。SA2会叫特区更改二进制日志文件,以人类可读的形式。 15.检查运行队列长度,使用 “-q”选项,进程和平均负载总数。
youcl@youcl ~ $ sar -q 2 5 Linux 3.11.0-23-generic (youcl.com) Thursday 04 September 2014 _i686_ (2 CPU) 02:00:44 IST runq-sz plist-sz ldavg-1 ldavg-5 ldavg-15 blocked 02:00:46 IST 1 431 1.67 1.22 0.97 0 02:00:48 IST 4 431 1.70 1.23 0.97 0 02:00:50 IST 2 431 1.70 1.23 0.97 0 02:00:52 IST 2 431 1.70 1.23 0.97 0 02:00:54 IST 0 431 1.64 1.23 0.97 0 Average: 2 431 1.68 1.23 0.97 016.检查有关使用 “-F”安装文件系统的统计数据。
youcl@youcl ~ $ sar -F 2 4 Linux 3.11.0-23-generic (youcl.com) Thursday 04 September 2014 _i686_ (2 CPU) 02:02:31 IST MBfsfree MBfsused %fsused %ufsused Ifree Iused %Iused FILESYSTEM 02:02:33 IST 1001 449 30.95 1213790475088.85 18919505 364463 1.89 /dev/sda1 02:02:33 IST MBfsfree MBfsused %fsused %ufsused Ifree Iused %Iused FILESYSTEM 02:02:35 IST 1001 449 30.95 1213790475088.85 18919505 364463 1.89 /dev/sda1 02:02:35 IST MBfsfree MBfsused %fsused %ufsused Ifree Iused %Iused FILESYSTEM 02:02:37 IST 1001 449 30.95 1213790475088.85 18919505 364463 1.89 /dev/sda1 02:02:37 IST MBfsfree MBfsused %fsused %ufsused Ifree Iused %Iused FILESYSTEM 02:02:39 IST 1001 449 30.95 1213790475088.86 18919505 364463 1.89 /dev/sda1 Summary MBfsfree MBfsused %fsused %ufsused Ifree Iused %Iused FILESYSTEM Summary 1001 449 30.95 1213790475088.86 18919505 364463 1.89 /dev/sda117.使用 “-n DEV”查看网络统计信息。
youcl@youcl ~ $ sar -n DEV 1 3 | egrep -v lo
Linux 3.11.0-23-generic (youcl.com) 	Thursday 04 September 2014 	_i686_	(2 CPU)
02:11:59  IST     IFACE   rxpck/s   txpck/s    rxkB/s    txkB/s   rxcmp/s   txcmp/s  rxmcst/s
02:12:00  IST     wlan0      8.00     10.00      1.23      0.92      0.00      0.00      0.00
02:12:00  IST    vmnet8      0.00      0.00      0.00      0.00      0.00      0.00      0.00
02:12:00  IST      eth0      0.00      0.00      0.00      0.00      0.00      0.00      0.00
02:12:00  IST    vmnet1      0.00      0.00      0.00      0.00      0.00      0.00      0.00
像使用iostat的 18查看块设备统计 “-D'。
youcl@youcl ~ $ sar -d 1 3 Linux 3.11.0-23-generic (youcl.com) Thursday 04 September 2014 _i686_ (2 CPU) 02:13:17 IST DEV tps rd_sec/s wr_sec/s avgrq-sz avgqu-sz await svctm %util 02:13:18 IST dev8-0 0.00 0.00 0.00 0.00 0.00 0.00 0.00 0.00 02:13:18 IST DEV tps rd_sec/s wr_sec/s avgrq-sz avgqu-sz await svctm %util 02:13:19 IST dev8-0 0.00 0.00 0.00 0.00 0.00 0.00 0.00 0.00 02:13:19 IST DEV tps rd_sec/s wr_sec/s avgrq-sz avgqu-sz await svctm %util 02:13:20 IST dev8-0 7.00 32.00 80.00 16.00 0.11 15.43 15.43 10.8019.要打印内存统计信息使用 '-r'选项。
youcl@youcl ~ $ sar -r 1 3
Linux 3.11.0-23-generic (youcl.com) 	Thursday 04 September 2014 	_i686_	(2 CPU)
02:14:29  IST kbmemfree kbmemused  %memused kbbuffers  kbcached  kbcommit   %commit  kbactive   kbinact   kbdirty
02:14:30  IST   1465660   2594840     63.90    133052   1549644   3710800     45.35   1133148   1359792       392
02:14:31  IST   1472724   2587776     63.73    133060   1549792   3715504     45.40   1125816   1360000       836
02:14:32  IST   1469112   2591388     63.82    133060   1550036   3705288     45.28   1130252   1360168       804
Average:      1469165   2591335     63.82    133057   1549824   3710531     45.34   1129739   1359987       677
使用“ 连续输稿器-d”20,我们可以提取其中可利用数据库处理格式的数据。
youcl@youcl ~ $ safd -d /var/log/sa/sa20140903 -- -n DEV | grep -v lo
# hostname;interval;timestamp;IFACE;rxpck/s;txpck/s;rxkB/s;txkB/s;rxcmp/s;txcmp/s;rxmcst/s;%ifutil
youcl;2;2014-09-03 07:53:29 UTC;eth0;1.50;0.00;0.13;0.00;0.00;0.00;0.00;0.00
youcl;2;2014-09-03 07:53:31 UTC;eth0;2.00;0.00;0.18;0.00;0.00;0.00;0.00;0.00
youcl;2;2014-09-03 07:53:33 UTC;eth0;1.00;0.00;0.09;0.00;0.00;0.00;0.00;0.00
youcl;2;2014-09-03 07:53:35 UTC;eth0;2.00;0.00;0.18;0.00;0.00;0.00;0.00;0.00
youcl;14778;2014-09-03 11:59:54 UTC;eth0;1.78;1.17;1.10;0.18;0.00;0.00;0.00;0.00
youcl;2;2014-09-03 11:59:56 UTC;eth0;3.50;3.00;0.60;0.77;0.00;0.00;0.00;0.00
youcl;2;2014-09-03 11:59:58 UTC;eth0;0.00;0.00;0.00;0.00;0.00;0.00;0.00;0.00
youcl;2;2014-09-03 12:00:00 UTC;eth0;0.00;0.00;0.00;0.00;0.00;0.00;0.00;0.00
youcl;2;2014-09-03 12:00:02 UTC;eth0;0.50;0.50;0.48;0.03;0.00;0.00;0.00;0.00
youcl;2;2014-09-03 12:00:04 UTC;eth0;2.50;3.50;0.21;2.05;0.00;0.00;0.00;0.00
youcl;2;2014-09-03 12:00:06 UTC;eth0;1.49;1.00;0.62;0.06;0.00;0.00;0.00;0.00
youcl;2;2014-09-03 12:00:08 UTC;eth0;0.50;0.00;0.03;0.00;0.00;0.00;0.00;0.00
youcl;2;2014-09-03 12:00:10 UTC;eth0;0.50;0.50;0.03;0.04;0.00;0.00;0.00;0.00
youcl;2;2014-09-03 12:00:12 UTC;eth0;1.00;0.50;0.12;0.04;0.00;0.00;0.00;0.00
你也可以保存到csv,然后可以绘制图表的介绍类的东西,如下。
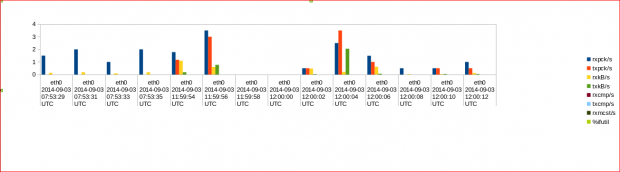
网络图